- HOME
- Organize
- UNIT #1
- G.CO - Overview
- G.CO.1 - Definitions
- G.CO.2 - Functions & Isometries
- G.CO.3 - Symmetries of Shapes
- G.CO.4 - Transformations
- G.CO.5 - Transformation Sequences
- G.CO.6 - Concepts of Congruence
- G.CO.7 - Congruence
- G.CO.8 - Congruence Criteria
- G.CO.9 - Proof (Lines/Angles)
- G.CO.10 - Proof (Triangles)
- G.CO.11 - Proof (Quadrilaterals)
- G.CO.12 - Basic Constructions
- G.CO.13 - Advanced Constructions
- UNIT #2
- G.SRT - Overview
- G.SRT.1 - Dilations
- G.SRT.2 - Similarity
- G.SRT.3 - Similarity Criteria
- G.SRT.4 - Proof (Triangles)
- G.SRT.5 - Geometric Mean & SRT
- G.SRT.6 - Trigonometric Ratios
- G.SRT.7 - Sine & Cosine Relationship
- G.SRT.8 - Solve Problems
- G.SRT.9 - Area Formula
- G.SRT.10 - Derive Sine/Cosine Laws
- G.SRT.11 - Apply Sine/Cosine Laws
- UNIT #3
- UNIT #4
- UNIT #5
- UNIT #6
- G.CP - Overivew
- G.CP.1 - Sample Spaces
- G.CP.2 - Independence
- G.CP.3 - Conditional Probability
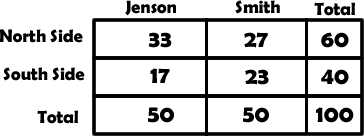
- G.CP.4 - Two Way Frequency Tables
- G.CP.5 - Probability Everyday
- G.CP.6 - Given That Rule
- G.CP.7 - Addition Rule
- G.CP.8 - Multiplication Rule
- G.CP.9 - Permutations/Combinations
- G.MD.6 - Fair Decisions
- G.MD.7 - Analyze Decisions
- Resources
- Interaction