| |
CONCEPT 1 – Sample Spaces as Sets
While probability has not typically been connected to geometry, the common core restructuring has placed it within the geometry curriculum. Probability and statistics have a direct application to events we see in everyday life and as such they are a very important branch of mathematics for all students to understand.
Probability is often defined as how likely something is to happen. In determining how likely something is to happen we must first determine what the total number of things that could happen for any given event or experiment. The list of all possible outcomes is called the sample space.
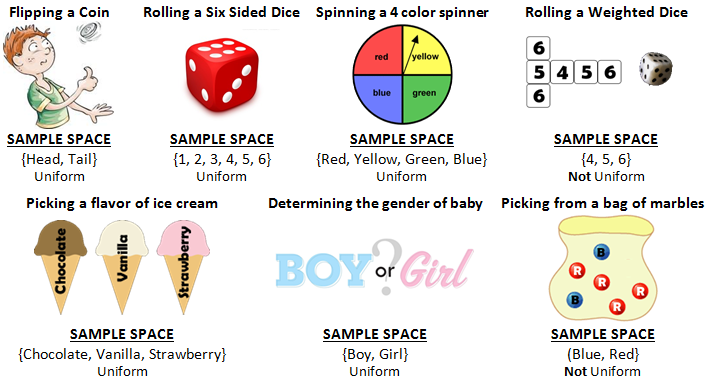
A LIST -- A sample space is often organized into a set of elements. For example the sample space for rolling a die is {1, 2, 3, 4, 5, 6} or the sample space for flipping a coin is {Head, Tail}. These two sample spaces represent uniform probability. Uniform probability is where each element of the set has the same chance of happening or in other words, each element is equally likely to happen. In a uniform probability, the number of elements in the set is the total number of outcomes possible for the sample space.
Some sample spaces are not uniform, such as a bag of marbles with 2 red and 1 green, the sample space is {red, green} because only a red or a green marble can be chosen. But in this sample space each element is NOT equally likely to happen because there are 2 ways to pick a red marble and only 1 way to pick a green. While there are only two elements listed in the sample space, the total number of outcomes of this sample space is 3, written n(S) = 3, because red has 2 ways of obtaining it and green has 1. The notation n(S) refers to the total number of outcomes possible in the set. Also notice when we list the elements of a set we use the set brackets {} and each element in the set is separated by a comma. {12, 34} is a set containing only two elements, whereas the set {1, 2, 3, 4} is a set containing 4 elements.
Some typical sample spaces written in set notation are:
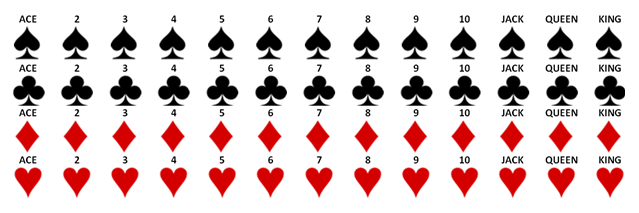
Some sample spaces can be quite large and difficult to list such as the 52 cards in a standard deck.
Large sample spaces can make listing them a daunting task and often quite inefficient. For this reason we have a few other ways to organize a sample space.

A TREE DIAGRAM. The first tree diagram below shows two flips of a coin. The first flip could be a head or a tail and then the second flip could produce a head or a tail from each of the previous options. The tree displays the sample space for flipping a coin twice as {HH, HT, TH, TT}. We also notice the number of elements of the sample space is (2)(2) = 4. In the second tree diagram below we see the sample space for selecting two scoops of ice cream where the choices are vanilla, chocolate, and strawberry. There are three choices for the first scoop and then the second choice gives us three more options for each previous option. The tree diagram displays the sample space for choosing a double scoop as {VV, VC, VS, CV, CC, CS, SV, SC, SS}. Again we notice an easy method for determining the number of elements in this sample space is to multiply 3 by 3 to get 9.
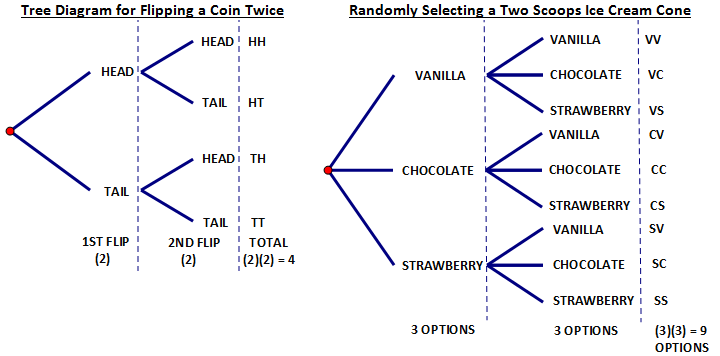 |
In this case, getting a head is as likely as getting a
tail. Thus this tree diagram represents a uniform probability. In this sample space each event is equally likely – getting a {Tail, Tail} is as likely as getting a {Head, Tail} or any of the other events. |
In this case, the choice of flavors might not be equally likely. If chocolate was the most popular flavor it would have a greater chance of being selected. The fact that each choice would not be equally likely would make the probabilities non-uniform. For example, getting {Chocolate, Chocolate} would be more likely to occur than {Strawberry, Strawberry}. |
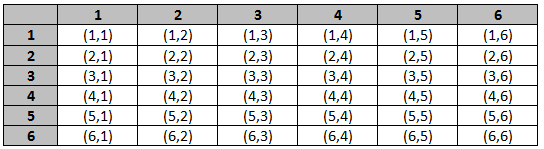
A TABLE OR CHART. A tree diagram would probably not be the best way to organize the sample space for all possible outcomes when rolling two dice. The tree would have 6 initial branches and then for each of those branches there would 6 more branches – in just two levels of the tree we would already have 36 branches. This would create a very large (hard to draw) tree diagram. A better way to organize this data might be to create a table.
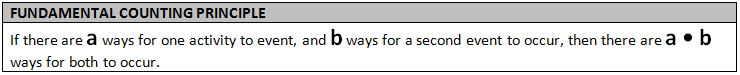
When dealing with the occurrence of more than one event or activity such as this one, it is important to be able to quickly determine how many possible outcomes exist without listing all of the possible events. In this case to determine the total number of outcomes we could simply multiply 6 times 6 to get 36. This simple multiplication process is known as the Fundamental Counting Principle.
The number of ways in which a series of successive things can occur is found by multiplying the number of ways in which each thing can occur.
Ex. #1 - The Club Restaurant offers 6 appetizers, and 14 main courses. What is the sample space if a person orders one appetizer & one main course?
|
(6)(14) = 84 |
Ex. #2 – A coin if flipped, a dice is rolled and a card is picked. What is the sample space for these events?
|
(2)(6)(52) = 624 |
Ex. #3 - The pass lock on a iPad requires a 4 digit password. What is the sample space for all 4 digit passcodes?
|
(10)(10)(10)(10) = 10,000 |
Ex. #4 - Jeff has 5 t-shirts, 3 pants, and 4 pairs of shoes. What is the sample space for all possible outfits?
|
(5)(3)(4) = 60 |
The fundamental counting principle handles the calculation for most sample spaces. We will look at the use of permutations and combinations to handle other types of situations at a later time.
CONCEPT 2 – Intuitive Idea of Probability
We use ratios to show how likely, or unlikely, an outcome might be. This ratio is called the probability of the event. A probability is expressed as:
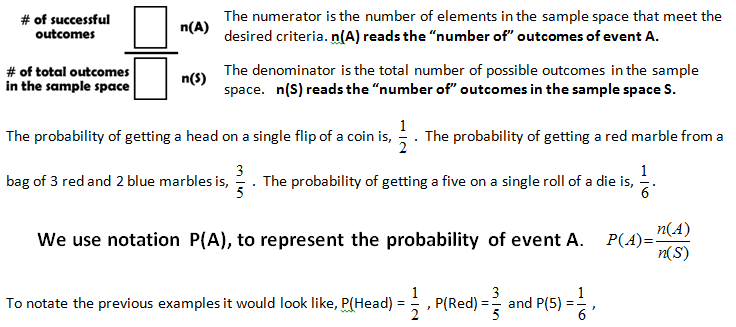
Ratios are most often expressed in the form of a fraction. Fractions, however, can be expressed as decimals or percent. So probabilities may be expressed as fractions, decimals or percent.
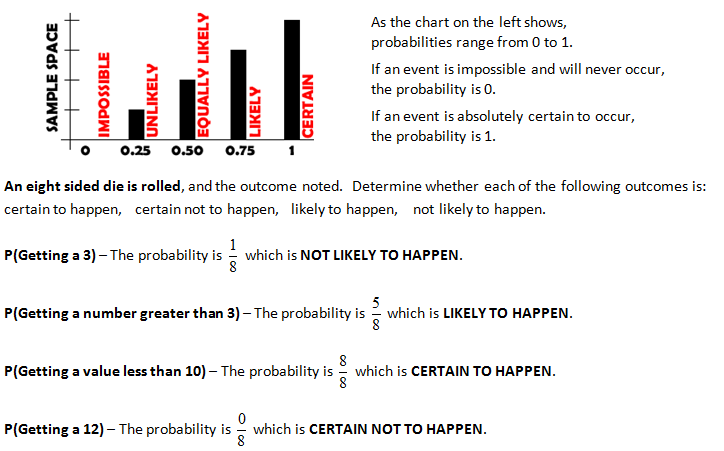
The range of the values for a probability is from 0 to 1. To have a probability of 0 means that it is impossible for the event to happen such as picking a red marble from a bag of 7 blue and 3 white marbles. To have a probability of 1 means that it is a certain event such as picking an even numbered tile from a bag that contain tiles with the numbers 2, 4, 6 and 12.
CONCEPT 3 – Diagramming the Sample Space using Venn Diagrams
A sample space represents all things that could occur for a given event. In set theory language this would be known as the Universal Set – all elements defined by that set. We often use Venn diagrams to display the relationships within sets and sample spaces.
Diagramming the Universal Set (Sample Space)
The universal set is usually diagrammed as a rectangle. The set name which is being used as the universal set is usually placed in the upper left hand corner of the shape. Depending on the size of the set you do not have to include all elements of the set in the diagram, usually a few are provided to give an image of some of the values of the set. If the set is small, then all elements should be listed.
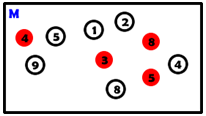
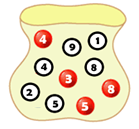 |
To diagram our sample space, the set M, a bag of marbles with 4 red marbles (solid) and 6 white marbles (empty) we create the rectangle, label it the universal set M, and then list out the elements of the set. In this case because there are only 10 elements it is easy to list them all out in the diagram. |
 |
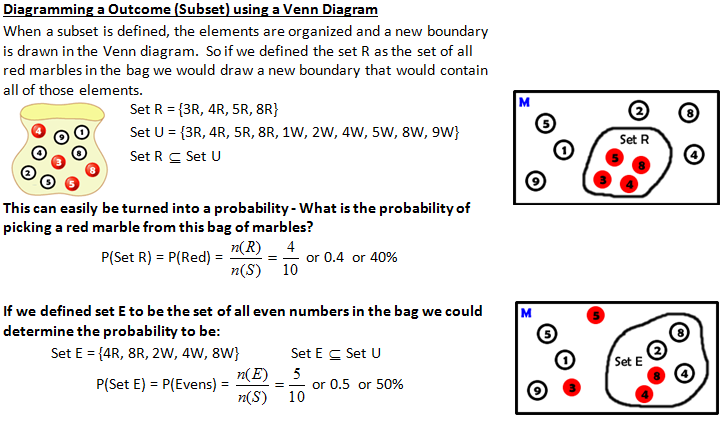
CONCEPT 4 – Define and Diagram Outcomes (Subsets) of the Sample Space (Universal Set)
A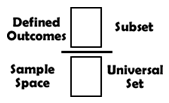 s stated earlier, a probability has two components, the sample space, which represents all possible things that could happen, and the defined successful outcomes, which represents the number of times a particular event occurs in that sample space. The outcome could be picking a heart from a deck of cards, rolling an even number on a dice, spinning a spinner and getting blue….. an outcome is simply a subset of the universal set. A subset is a collection of elements that all exist within another set. If all elements of set X belong to set Y, then it is said that set X is a subset of set Y. Any set formed with elements of the universal set is a subset of that universal set. s stated earlier, a probability has two components, the sample space, which represents all possible things that could happen, and the defined successful outcomes, which represents the number of times a particular event occurs in that sample space. The outcome could be picking a heart from a deck of cards, rolling an even number on a dice, spinning a spinner and getting blue….. an outcome is simply a subset of the universal set. A subset is a collection of elements that all exist within another set. If all elements of set X belong to set Y, then it is said that set X is a subset of set Y. Any set formed with elements of the universal set is a subset of that universal set.
For example if the sample space was rolling a D12 (a 12 sided dice) some subsets might be:
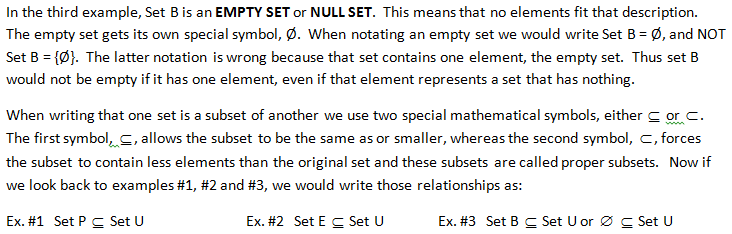
Rolling a prime number, Set P = {2, 3, 5, 7, 11} is a subset of Set U = {1, 2, 3, 4, 5, 6, 7, 8, 9, 10, 11, 12}
Rolling an even number less than 5, Set E = {2, 4} is a subset of Set U = {1, 2, 3, 4, 5, 6, 7, 8, 9, 10, 11, 12}
Rolling a number greater than 12, Set B = {} is a subset of Set U = {1, 2, 3, 4, 5, 6, 7, 8, 9, 10, 11, 12}
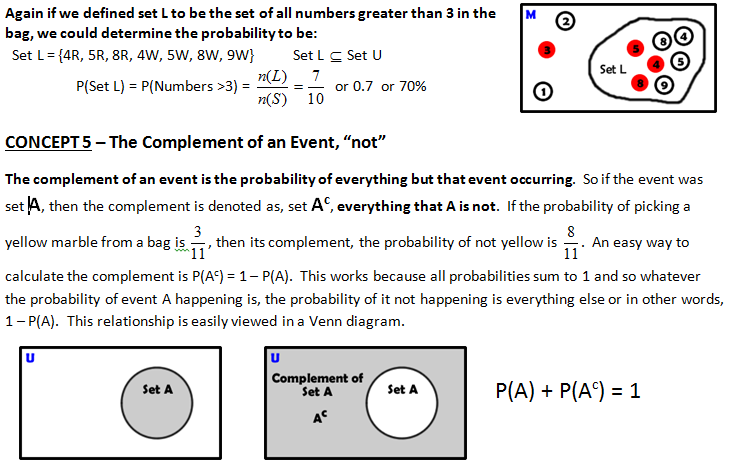
When determining the probability of a complement it is usually simplest to calculate the probability of the event and then subtract it from 1.
CONCEPT 6 – Mutually Exclusive or Disjoint Sets
More than one subset can be defined at a time from a universal set, so for example we could define the set of all red marbles, or the set of all even numbers, or the set of red marbles with numbers greater than 3 - the list seems like it could go on forever. Sometimes when we define more than one set at a time they have no elements in common. This is known as being mutually exclusive or disjoint. Two events are mutually exclusive events if the events
cannot both occur in the same trial of an experiment, for example the flip of a coin cannot be both heads and tails and thus those two events are mutually exclusive.
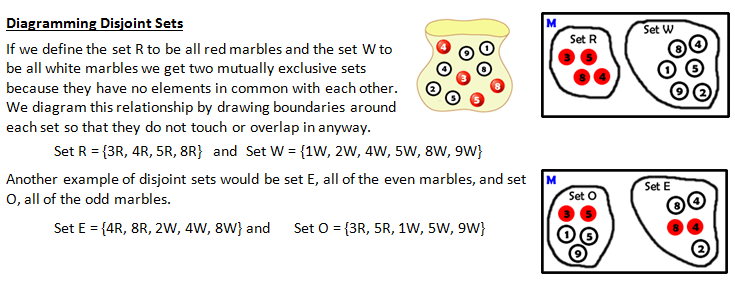
In both of these cases you cannot be both red and white or even and odd, thus they are mutually exclusive.
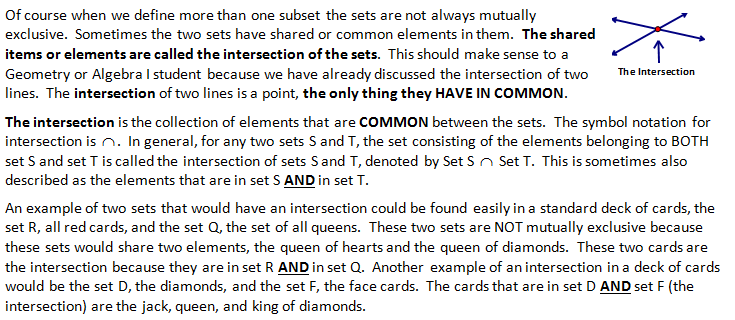
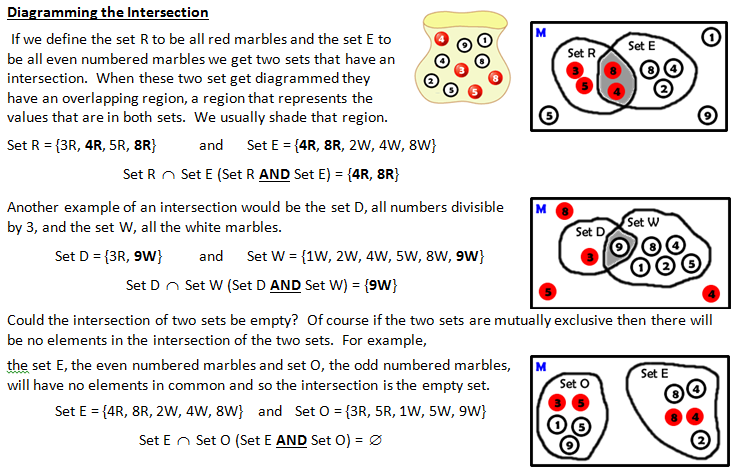
CONCEPT 7 – The Intersection, “AND”
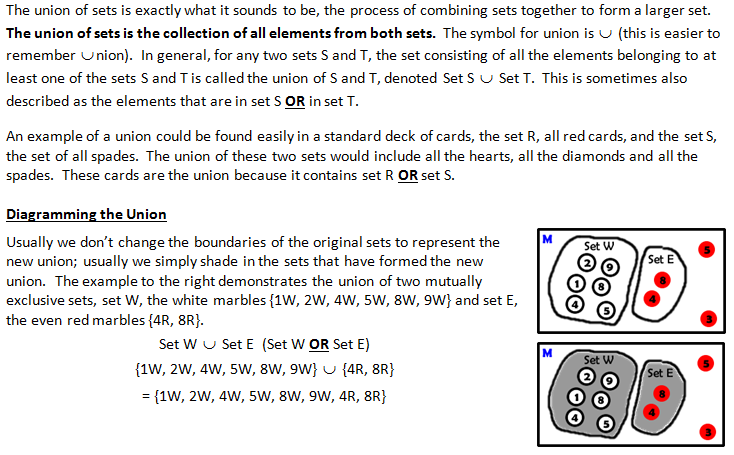
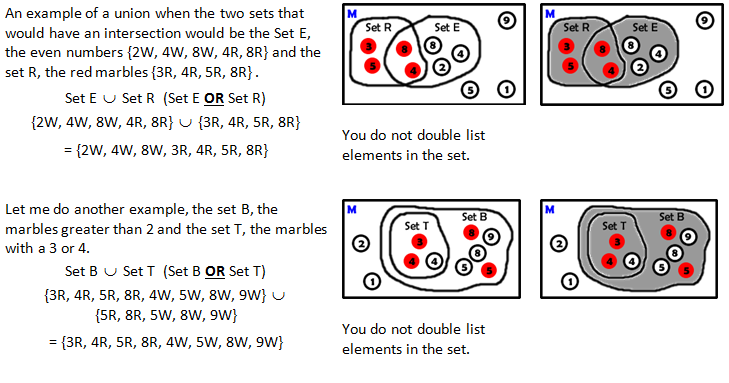
CONCEPT 8 – The Union, “OR”
|